The whole point of this post over at subtraction.com by Khoi Vinh was to invalidate the “Yankees bought a championship!” argument, and although an interesting read, not really something that this blog gives a crap about. However, in the data he pulled something interesting did pop up that related to St. Louis and our National League Central champ Cardinals.
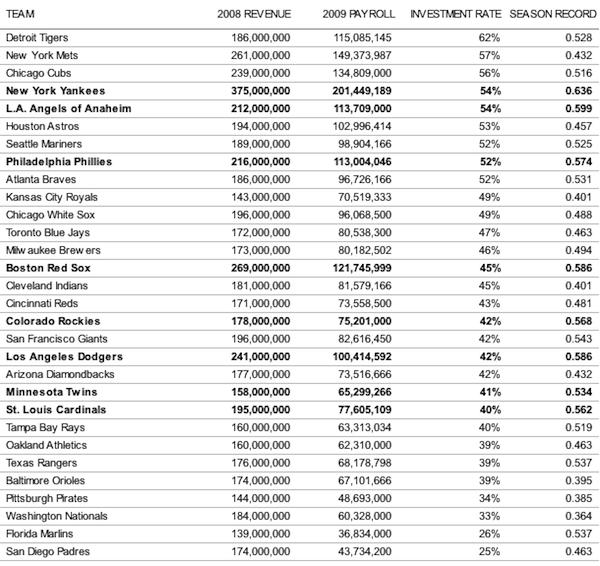
Vinh pulled the revenue each team made in 2008 and the payroll for the team in the 2009 season and compared the “investment rate” that the team operated on for the 2009 season along with their final record.
Despite the fact the Cardinals pulled in 195,000,000 in 2008, the starting 2009 payroll was at 77,65,109 giving them only a 40% Investment Rate in their revenue back in to the team. Which nets them only 23rd out of the 31 teams in the Investment Rate score, and dead last when you only look at the teams that made the 2009 playoffs (shown in bold).
Doesn’t look good for the home team.
However, notice I used the term starting payroll. That’s a key aspect that Vinh completely missed in his evaluation. Teams make trades through out the year, for both adding to and subtracting from the starting payroll submitted in April. That was especially true during the 2009 season when the economic climate took a toll on nearly every major league team in some way. To do a metric such as Vinh’s and not include the final playroll completely invalidates the whole chart.
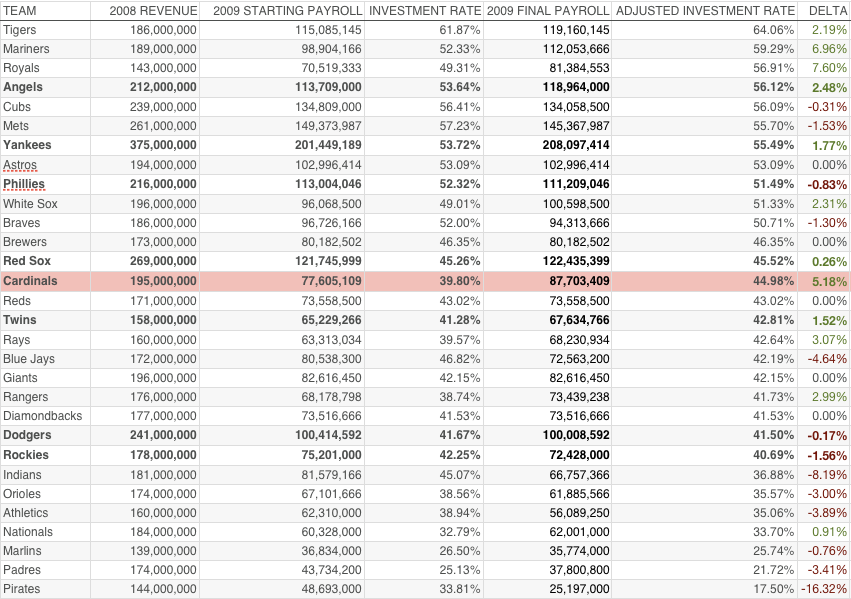
ESPN has a listing of the season-ending salaries for each team and added the following columns to Vinh’s original data: 2009 Final Payroll, Adjusted Investment Rate, and the Delta between the two Investment Rates. (Click on the image to see a full-sized, more readable chart)
What a difference 162 games make!
Adding in the final 2009 salaries, and calculating the Adjusted Investment Rate, the Cardinals jump from 23rd over all to a dead center, 15th. Not only that, but the Cardinals hopped over three of their playoff counterparts (the Twins, Dodgers and Rockies) to go from dead last in the eight team playoff set to 5th and snuggling up right behind the Red Sox.
Also interesting is the Yankees who Vinh trumpeted with his numbers, fell from 4th to 7th despite actually going up with their Adjusted Investment Rate. But most surprising of all is that the Royals ended up in 3rd place after making the single largest positive difference in their payroll this season. I guess David “Walmart” Glass finally found his wallet over there on the other side of the state. It was probably in the last place he looked…
Oh and if you want to know what a “fire sale” looks like. Move your lookin’ balls to the end of the list where the Pirates fell after trimming off nearly 23.5 Million off of their opening day roster!
Finally, the Cardinals, who certainly take their hits for being “cheap”, fare a bit better when the number are actually tallied correctly, coming out dead average on paper as far as the revenue invested in the team. Eh, its not great, especially when your bitter rival is sitting at #5. Although we certainly think they could spend a little more to keep up as they certainly have it, there are more operational costs than just the payroll, so all in all, we Cardinal fans don’t have much to complain about…until DeWitt tells us he didn’t have the money for Matt Holiday.
When that happens, come back and print out this graph.
More Info: Download our spreadsheet
Update:
This post was mention on the awesome Daring Fireball site and it took the site down pretty much all day. Still an honor!


